Flow charts
In the Flow Chart subtab, you can view a a high-level visual representation of a flow. Each icon represents an event, an action, or a function.
Because any flow must be triggered by a trigger such as an application event, an API Endpoint, a scheduled event, or a child flow, the first icon in a chart always represents a designated event that monitors for a change in your cloud application. Each subsequent icon represents one specific step in a flow.
To download a vector image file of the flow chart, click SVG.
Example
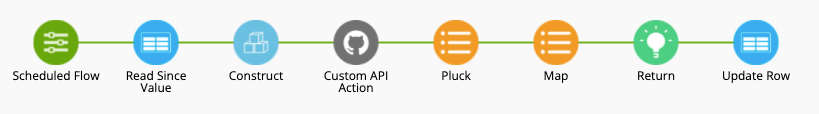
This flow chart illustrates a scheduled flow that will perform the following actions:
-
Read table rows that were updated after a specified date
-
Construct a JSON object
-
Perform an API action against a GitHub repository
-
Reduce (pluck) the body that was returned by the Custom API Action card based on a specified key
-
Use the Map function card to convert the output values from the List Pluck card into a new list by running a helper flow
-
Return values to the caller of the flow
-
Update a row in a table