Execution history details

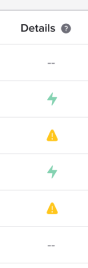
The Details column in your Execution History pane provides you with more information about your flow execution modes. Okta assigns each flow execution a specific icon to assist you in classifying flow execution:

Flow details: shows an image of a lightning bolt, indicating that the flow executed at the low-latency rate. - Low-latency

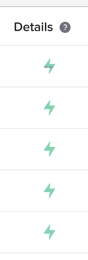
Flows that display the lightning bolt icon contain only cards that consistently executed efficiently and therefore the flow ran in low-latency mode. Generally this occurs for latency-sensitive webhook and API Endpoint use cases. See Low-latency flows.

Flow details: shows an image of a dash mark, indicating that the flow executed at the standard rate. - Standard

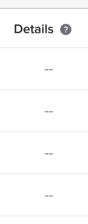
Flows that display a dash were executed at a standard rate. Any flow execution with a standard rate contains a card that is ineligible for low-latency mode.

Flow details: shows an image of an exclamation mark, indicating that the flow executed at the throttled rate. - Throttled

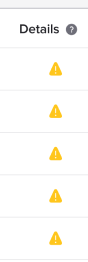
Flows that display the exclamation mark ran in throttled mode and experienced higher latency due to resource constraints. Throttled flows aren't eligible to run in low-latency mode.

Common scenarios for flow details

Flow details: image of a set of flow executions, all with dash marks indicating that the flows executed at the standard rate.
All standard
All flow executions used standard mode. This means that your flow contains a card that doesn't qualify for the low-latency mode.
Flow details: image of a set of flow executions, all with lightning bolts, indicating that the flows executed at the low-latency rate.
All low-latency
All flow executions used the low-latency mode. See Low-latency flows.
Flow details: image of a set of flow executions, with mixed icons, indicating that the flows executed at varying rates.
Mixed
Only some executions of your flow used the low-latency mode. Check your flow for cards that you can modify to remove latency issues so the flow always runs in low-latency mode.
Flow details: image of a set of flow executions, all with warning icons, indicating that the flows executed in throttled mode.
All throttled
All flow executions exceeded the resource limits and were throttled. After a flow is throttled, it remains in the throttled mode for 15 minutes. See Execution limits.