Troubleshoot apps
Configure an app for simulation testing
- Go to the Access Gateway Admin UI console.
- From the Topology tab or the Applications tab, open the app.
- Click the Settings pane.
- Expand the Essentials tab.
- Note the current value of Protected Web Resource.
- Copy and save the value of the Protected Web Resource field in a secure location. You need this value when you turn debug mode off.
- Change the Protected Web Resource field to one of these values:
Value Behavior http://header.service.spgw This displays information about the header, cookie, session, and other information. http://policy.service.spgw This displays information about the app policy. - Clear the Customize checkbox to disable the post-login URL.
- Expand the Advanced tab.
- Enable Debug mode. When you enable Debug mode, ensure that the downloadable log file has also been set to the Debug level. App debug events aren't visible in downloadable log files unless you configure them to emit debug-level log events. See Manage log verbosity
- Click Done.
When debugging header-based apps, test attributes with static known good values. For example, change dynamic IdP-based fields to static ones with known good values. When debugging policy-based apps, test with no policy or an open policy first.
Monitor logs from the Access Gateway Management console
- Use Secure Shell (SSH) to connect to the Access Gateway Management console, as in this example: ssh oag-mgmt@gw-admin.<domain.tld>
- Sign in to the Access Gateway Management console.
- Enter 4 - Monitoring.
- Enter 2 - Enable Debug.
- Enter 1 - Monitor logs. The console displays the log messages.
- Return to the Access Gateway Admin UI console and run the app that you want to examine. See Management Console command-line reference.
- Enter [Ctrl]-[c] to exit the log display.
- Enter 2 - Disable debug.
The debug logging level rapidly generates log messages. Always disable debug logging when you have finished examining logging. Otherwise, you may run out of disk space.
Test policies
- Select the Applications tab.
- On the row containing the app, click .
- Sign in if required.
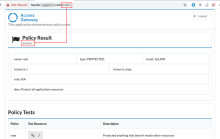
- For policy-based testing, update the URL to add an appropriate path and resend the request. This example adds the /public path:
Test header apps
- Select the Applications tab.
- On the row containing the header app, click .
- Sign in if required.
- Examine the Access Gateway Management console for errors or log events.

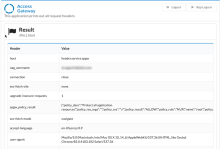
- Examine the result of the test.
When the Debug mode is activated on production apps, it can impact the performance. After you've finished, always reset the Protected Web Resource field and deactivate the Debug mode toggle. Otherwise, Access Gateway may rapidly generate log files and you may run out of disk space.
Disable debug mode
Display debug statements at the command line
- Go to the Access Gateway Management console.
- Enter [Ctrl]-[c] to exit the log display.
- Enter 3 - Disable debug.
- Exit the command-line console.
App debug is enabled
- Go to the Access Gateway Admin UI console.
- Go to the app you're testing.
- Expand the Setting tab.
- Expand the Essentials tab.
- Return the Protected Web Resource field back to its original value.
- Expand the Advanced tab.
- Set the Debug toggle to Disable.
- Save your changes.


