Metrics monitoring
Access Gateway produces metrics that monitoring systems can use.
Metrics-based monitoring includes:
- Metrics collector: Access Gateway implements a custom collector that tracks metrics such as swap, CPU, disk, I/O, and other metrics
- Publication format: Access Gateway provides metrics in the Open Metrics format.
- Transport: Access Gateway exposes metrics using either REST and a well-defined endpoint, or a push mechanism.
The following diagram demonstrates the flow of metrics in Access Gateway:
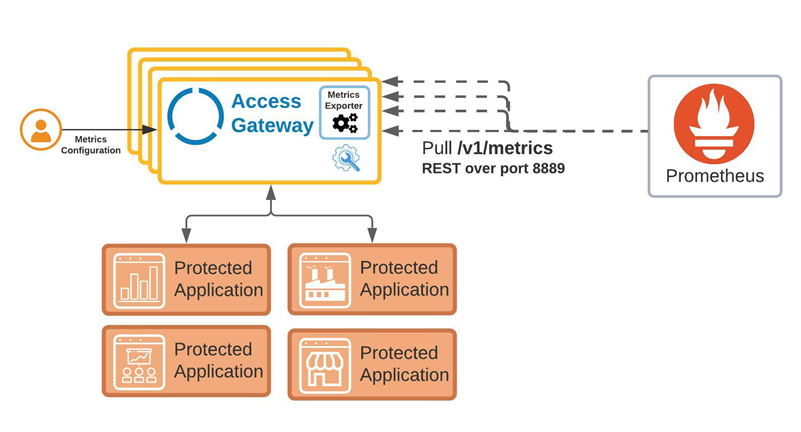
The components in the preceding architecture diagram include:
- One or more instances of Access Gateway.
- An instance of Prometheus.
- A set of configuration settings that define metrics gathering intervals, allowed IP addresses, and whether to enable metrics gathering.
- A set of protected web resources.
Before you begin
Ensure that:
Port 8889 is open between the monitoring implementation and Access Gateway nodes.
Typical implementation taskflow
|
Task |
Description |
|---|---|
| Open port 8889 | Ensure port 8889 is accessible from the monitoring solution and all Access Gateway nodes. See Prerequisites for deploying Access Gateway for more information about all ports and other prerequisites for deploying Access Gateway. |
| Configure metric monitoring | Configure Management console metrics monitoring. |
| Test Metrics monitoring using ReST | Use cURL to test ReST calls against each configured Access Gateway instance. Test against each Access Gateway cluster member and the admin node. |
| Configure clients | Configure a pull-based client to use the metrics monitoring to monitor all cluster members (for example, Prometheus). |
| Examine supported metrics | Examine the set of supported metrics and configure the monitoring client accordingly. See Metrics returned for a complete list of all metrics, their types and descriptions. |